OPPORTUNITY
COMPASS
Overstock.com
the problem
Overstocks product catalog, due to changing requirements and legacy systems, was missing key data points (attributes, images, options not being combined, etc.). This not only affected the find-ability of products onsite but was causing issues with sales and customer satisfaction.
The need for Actionable Data
We focused on making the data actionable by directly linking to the products that had the issue. Further we created guidance to help the users not only target the most important changes first but also guide them through the changes step by step if needed/wanted.
My Role
I was the lead UX Designer on this project. I did user research, analysis, testing, wire-framing, prototyping, and generated the final designs and requirements. I also put together the design document for our patent filing. Thought-out this project, I also collaborated with project managers, developers and data analysts.
Key Results
↑ 80%
more top tier attributes
↑ 20%
partner engagement
10-20%
product sales lift
Affinity Diagram
We started by working through all the data that is involved with building out a product. We scored the areas by importance as well as found issues that exist that affect the effectiveness of changes.

Data Prototype
Working with our internal teams we formulated a paper based prototype for a few partners. In this prototype we targeted the partners top 200 products. We studied how the changes affected find-ability and sales.
The Findings
We found significant lifts even when only targeting the top 200 products. Even thought this proved effective it was not scalable and needed further research to determine the best way to implement at scale.
The Competition
In meeting with our partners we learned that this was not something that our competitors were doing.

Elements
This step helped us understand what the core elements and larger scored areas of our partners catalog should be to get the best lift.
Scores
We found that there was a huge opportunity for partners to better their score. Most scores were in the 20th percentile and below.

What Was Missing
By identifying areas that were missing or under represented in the scores we were able to formulate a more wholistic approach.

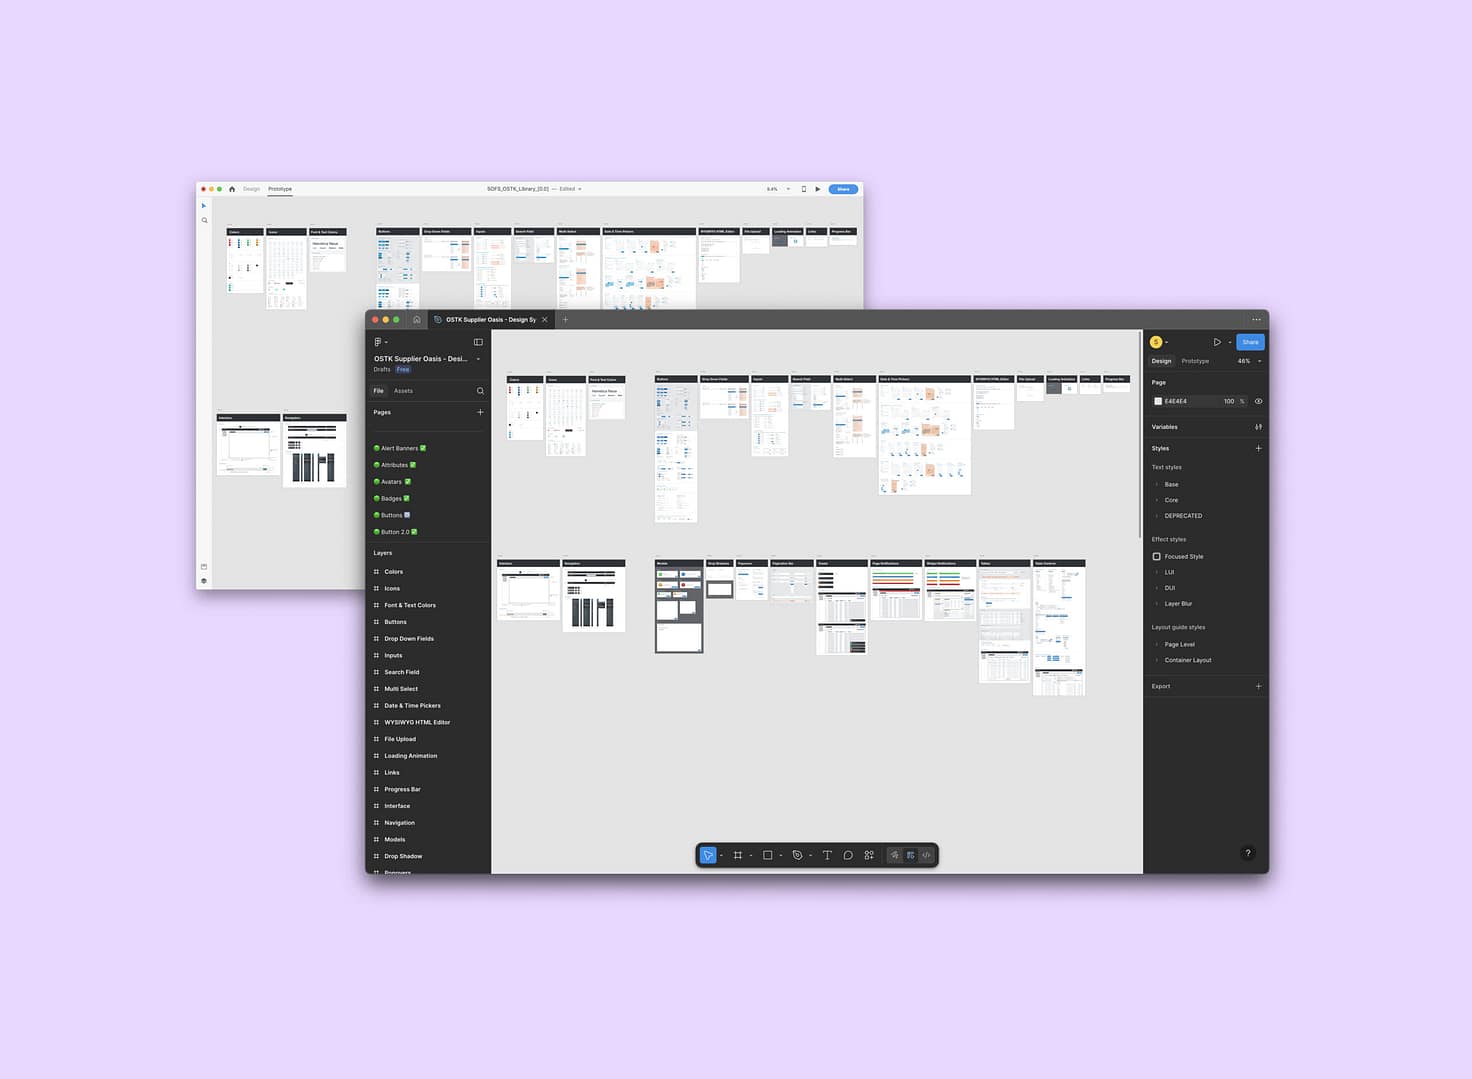
Prototype
Our prototype went through multiple internal rounds of review before it was ready to user test our partners.

User Test
Using a formulated test we walked through a scenario to help pinpoint what was viewed as priority, what the meaning of individual areas were, and what elements represented.
Data
We based the data set off of a combined data set of multiple partners so that the numbers and percentages would be more accurate to what a partner might actually see.

User Testing
We reviewed all 10 moderated sessions and consolidated common feedback, outlier feedback, and any open questions.
Testing Loop
We preformed 3 rounds of testing meeting with 50-70% of reoccurring users. Through this user testing we were able to review changes and additions with previously tested users and compare that with new users responses.


Internal Reporting
We followed the same prototype and user testing approach to create an internal reporting view. This let us know what changes were happening and what partners were meeting goals.
Intelligent
We designed and built the internal tool to be intelligent and help our internal teams quickly see what parters needed additional help and what partners were preforming well. This let our teams reward partners that were over performers.

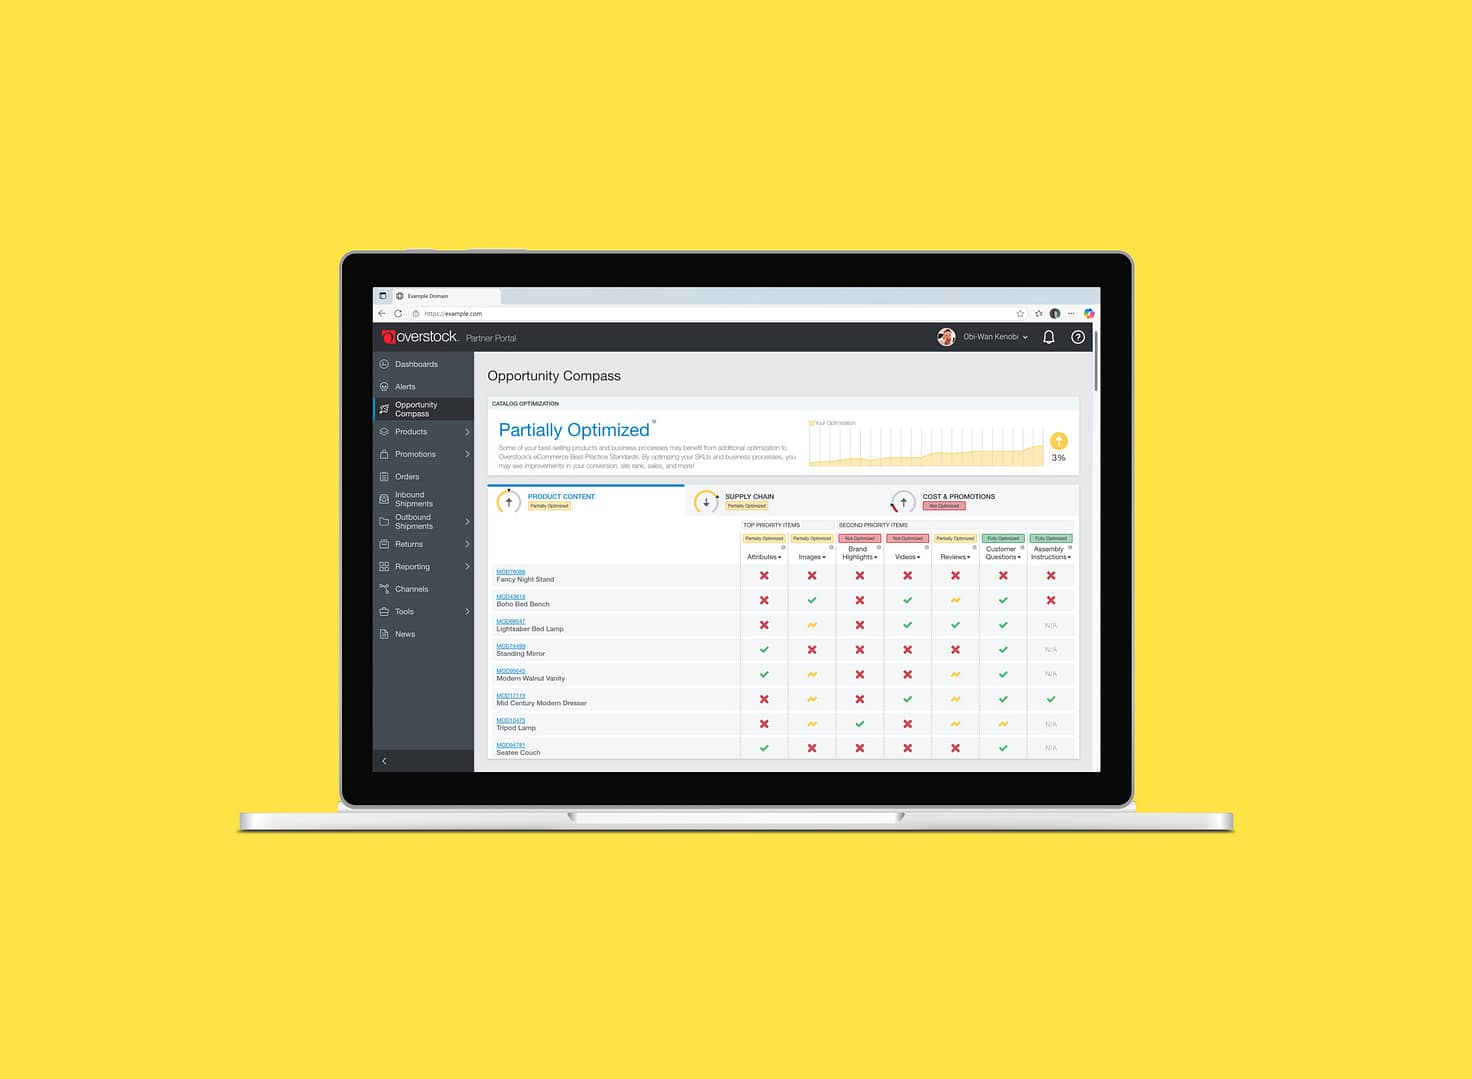
FINAL DESIGNS
Examples of the final designs for Opportunity Compass.


Key Results
↑ 80%
more top tier attributes
↑ 20%
partner engagement
10-20%
product sales lift
RECAP &
TAKEAWAYS
Actionable Data
We focused on making the data actionable by directly linking to the products that had the issue. Further we created guidance to help the users not only target the most important changes first but also guide them through the changes step by step if needed/wanted.
Takeaways
Having a tool that helps our partners know what data is missing or is stagnate helps our partner correct issues and simultaneously trains them on how to build better products.
Next Steps
The proposed next evolution of this tool is to add this data into the product editing area of Supplier Oasis. This will allow partners to see what data is bad/ missing when they are making other changes to their products.
Patent
I’m a co-inventor for the patent of this new personalized recommendation system.
Still looking? Here's more of my work
© Steven Jeppesen 2026